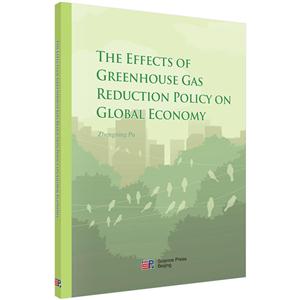
基于MRCGE-GTAP的温室气体减排分析(英文版)
目录
ContentsPreface1. Origin of Greenhouse Gas Issue 12. Literature Review 52.1 What is CGE Model? 52.2 CGE Analysis on Carbon Tax Effect Worldwide 72.3 CGE Analysis on Carbon Tax Effect in China 92.4 Current Multi-Regional CGE Models 112.4.1 MMRF-Green Model 112.4.2 GTAP-E Model 173. Responses to Current Climate Change 233.1 International Responses 233.2 Nation and Regional Political Responses 283.3 Responses from Multinational Cooperations 303.4 China’s Responses 334. Will China’s Energy Resource Tax Policy Work? 414.1 Model Structure 414.2 Data and Scenario 484.2.1 Regional Division 484.2.2 Industry Classification 504.2.3 Scenarios 514.3 Analysis Results 524.3.1 National Level Effect 524.3.2 Regional Level Effect 564.3.3 Industry Indicator 604.4 A Dynamic Extension 624.4.1 Model Extension 624.4.2 Data Resource and Scenario Setup 634.4.3 Results 644.5 Conclusion 695. What Will Happen When the World Works Together? 715.1 Model Structure 715.2 Data and Scenario 815.2.1 Regional Division 815.2.2 Industry Classification 825.2.3 Scenarios 845.3 Analgsis Results 865.3.1 Changes in EV and CO2 Emission Reductions in China 865.3.2 China’s Industry Changes 885.3.3 Change of Household EV and CO2 Reduction of World Regions 885.3.4 Industrial Output in World Regions 915.4 Conclusion 1006. Concluding Remarks 1036.1 Simulation Model Construction 1036.2 Analysis for China 1046.3 Analysis for the World 1066.4 Conclusion 106Reference 107Appendix 111Model 1: One National, Multi-Region, Static Model 112Model 2: Multi-National, Multi-Region, Static Model 130Model 3: One National, Multi-Region, Dynamic Model 196Acknowledgment 212Tables and ChartsFig.2.1 Household Demand in MMRF-Green 12Fig.2.2 Production Structure in MMRF-Green besides Electricity Sector 13Fig.2.3 Production Structure in MMRF-Green Electricity Sector 14Fig.2.4 Creation of Capital Goods in MMRF-Green 15Fig.2.5 GTAP-E Production Structure 19Fig.2.6 GTAP-E Capital-Energy Composite Structure 19Fig.2.7 GTAP-E Government Purchases 20Fig.2.8 GTAP-E Household Private Purchases 21Fig.4.1 Production Structure 42Fig.4.2 Household Activities 43Fig.4.3 Government Activities 44Fig.4.4 Export Structure 45Fig.4.5 Import Structure 46Fig.4.6 CO2 Reduction and Energy Intensity Rate of Change 54Fig.4.7 National MAC under Different Scenarios 55Fig.4.8 Regional GDP Rate of Change 57Fig.4.9 Regional Household Utility Change 57Fig.4.10 Per Capita Household Utility Change 58Fig.4.11 Regional Petroleum and Natural Gas Mining Industry Output Reduction 59Fig.4.12 Regional Coal Mining Industry Output Reduction 60Fig.4.13 Industry Output Rate of Change 61Fig.4.14 Regional Investment Rate of Change 66Fig.4.15 Regional Household Consumption Rate of Change 66Fig.4.16 Regional GRP Rate of Change 67Fig.4.17 National GDP Rate of Change 67Fig.4.18 Regional Coal Mining Output Rate of Change 68Fig.4.19 Regional Oil and Gas Mining Output Rate of Change 69Fig.5.1 Production Structure 72Fig.5.2 Household Activities 72Fig.5.3 Government Activities 73Fig.5.4 Export Structure 73Fig.5.5 Import Structure 73Fig.5.6 Production Structure for World Region 74Fig.5.7 Private Sector Activities for World Region 76Fig.5.8 Government Activities for World Region 77Fig.5.9 Export Structure for World Region 78Fig.5.10 Import Structure for World Region 79Fig.5.11 China’s Regional EV Change 86Fig.5.12 China Regional CO2 Emission Reduction Rate of Change 87Fig.5.13 China’s Industry Output Rate of Change 89Fig.5.14 World Region EV Change 90Fig.5.15 World CO2 Emission Reduction Rate under Different Scenarios 91Fig.5.16 Industry Output Rate of Change of “OCN” Area 92Fig.5.17 Industry Output Rate of Change of “JPN” Area 93Fig.5.18 Industry Output Rate of Change of “GCA” Area 94Fig.5.19 Industry Output Rate of Change of “IND” Area 95Fig.5.20 Industry Output Rate of Change of “ROA” Area 96Fig.5.21 Industry Output Rate of Change of “RUS” Area 97Fig.5.22 Industry Output Rate of Change of “USA” Area 98Fig.5.23 Industry Output Rate of Change of “EU27” Area 99Fig.5.24 Industry Output Rate of Change of “ROW” Area 100Table 3.1 Details about Each COP Conference 23Table 4.1 Regional Division Code 48Table 4.2 Reclassified Commodity Sectors 50Table 4.3 Scenario Setup 52Table 4.4 National Level Indexes 53Table 4.5 Regional Industry Output Rate of Change in the Year 2012 65Table 5.1 World’s Regional Division 82Table 5.2 Reclassified Commodity Sectors 83Table 5.3 Reduction Target for Developed Countries 85Table 5.4 Scenario Setup 85Picture 4.1 Region Code for 8 Division Regions in China 48P
封面

书名:基于MRCGE-GTAP的温室气体减排分析(英文版)
作者:Zhengning Pu[著]
页数:211页
定价:¥99.0
出版社:科学出版社
出版日期:2017-01-01
ISBN:9787030541659
PDF电子书大小:100MB 高清扫描完整版
本文标题:《基于MRCGE-GTAP的温室气体减排分析(英文版)》PDF下载
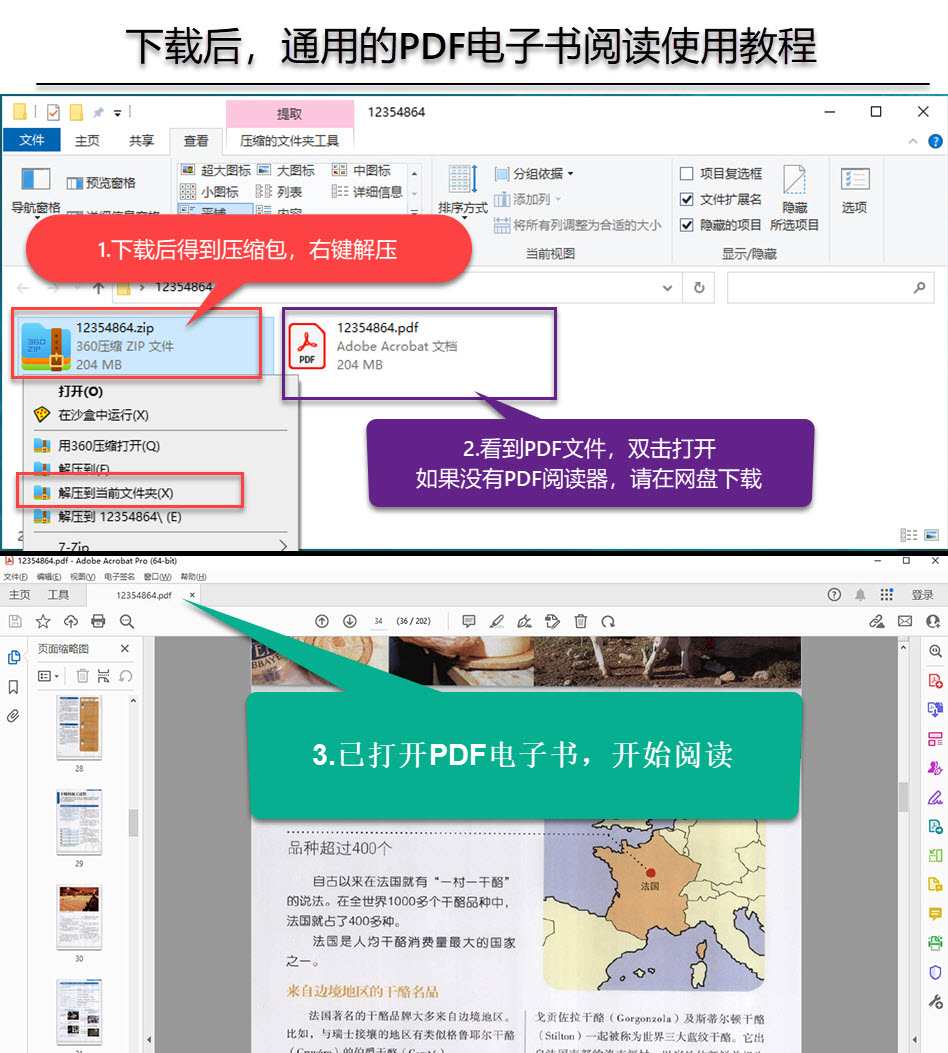
资源仅供学习参考,禁止用于商业用途,请在下载后24小时内删除!

